Pivot
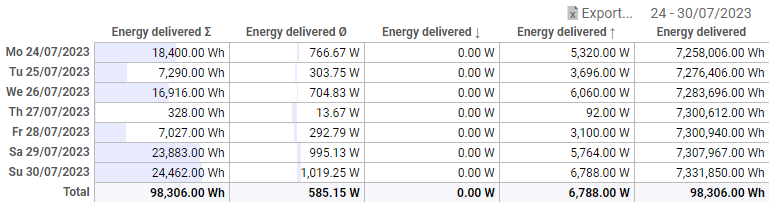
The pivot is a vizual for tabular representation of historical analyses. Aggregated values of multiple tags can be displayed side by side for comparison.
Aggregation
Depending on the type of the tag, different functions are offered for aggregating the data.
Numeric tags
- Average
- Sum
- Min
- Max
Counter tags
- Current count: Interpolated counter reading at the beginning of the time interval.
- Current count (Min): Smallest measured counter reading of the time interval.
- Current count (Max): Largest measured counter reading of the time interval.
Logic tags
- Average: Percentage of how long the value was active within the time interval.
- Sum: Operating hours within the time interval.
- Active count: Number of measurements with
TRUEvalue. - Active days count: Number of days that have at least one measurement
TRUE. - Change count: Number of changes
TRUEandFALSE.
Calculated columns
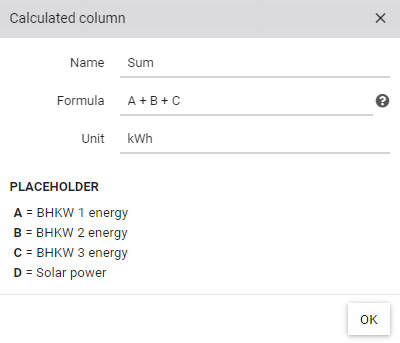
In addition to the columns that contain the aggregated values of a tag, calculated columns can also be configured. To do this, click on Add calculated column. The dialog can be used to define the column name, formula and unit. The existing columns can be referenced with placeholders from A to Z. For quicker orientation, the column names of the available placeholders are displayed at the bottom of the dialog.
Comparison function
In addition to the values for the current time range, an additional column with the previous time range can be displayed using the Comparison column option. If, for example, the year 2023 is selected in the pivot, the comparison column contains the months of the year 2022. You can also display the absolute or percentage difference.
Weather adjustment
Nach Aktivieren der Vergleichsfunktion erscheint bei Zähler-, Verbrauchs- und berechneten Datenpunkten die Option Witterungsbereinigung. Anhand von den Tagesdurchschnittstemperaturen werden die Gradtagszahlen ermittelt, um einen Korrekturfaktor zu ermitteln, der auf die Vergleichswerte angewandt wird.
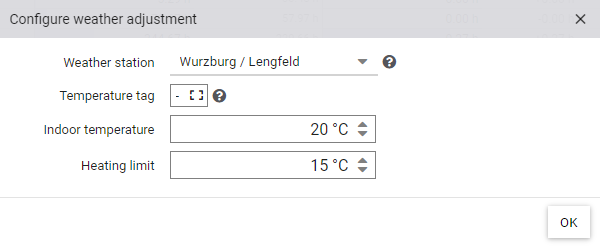
Congiure weather adjustment
The average outdoor temperature is required to determine the degree day figures. If no recorded outdoor temperature values are available, these will be determined from the nearest weather station. Check if the preselected weather station is suitable and adjust the selection if necessary. Tip: Make sure that the correct location is configured in the project settings. If the project has recorded outdoor temperatures, the tag can be used prior to the weather station data.
The degree day figure is calculated on the days whose average temperature is below the heating limit. This is done by determining the difference between the indoor temperature and the average outdoor temperature. The indoor temperature and heating limit vary depending on the region. For example, the German VDI guideline defines an indoor temperature of 20°C and a heating limit of 15°C. In Austria, Switzerland and Liechtenstein, on the other hand, a heating limit of 12°C is used.
Interaction with the pivot
The time range can be selected within the pivot. This can be done either via the time range selection or by clicking on a cell with a time range. The tag information can be opened via the individual cells.