Sankey
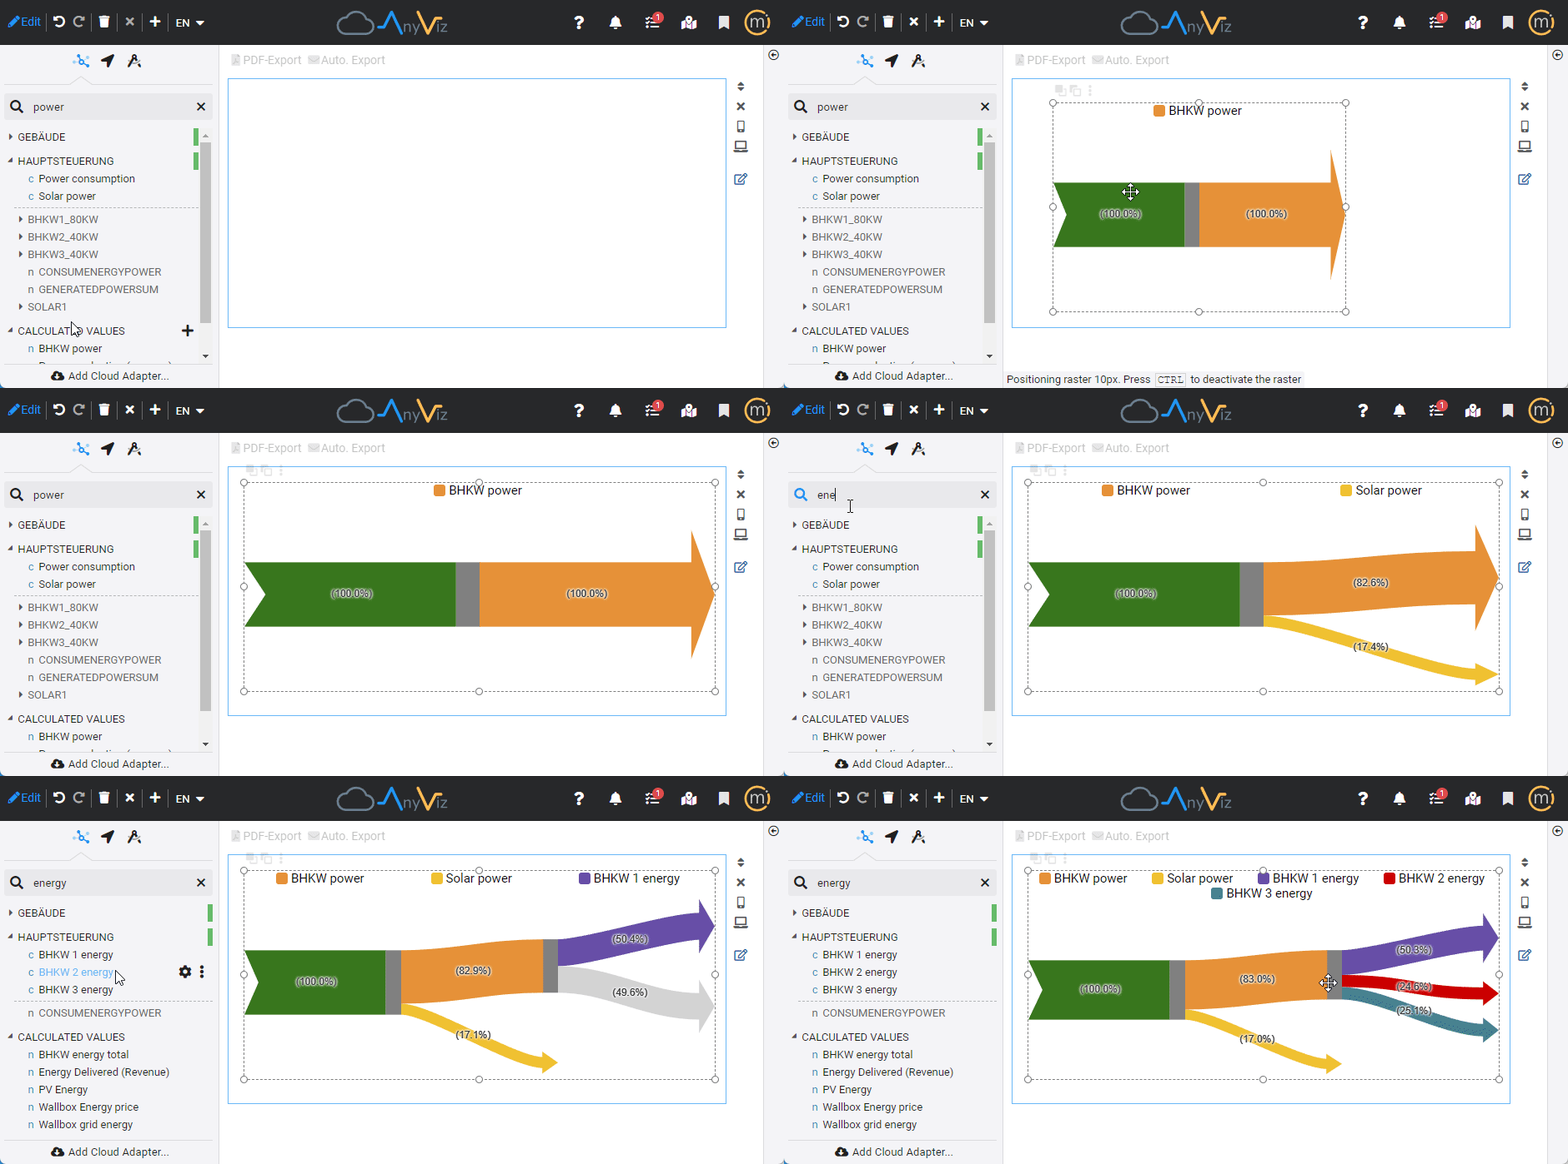
The Sankey-Vizual is a graphical representation of quantity flows. An input quantity can be subdivided several times. The subsets are represented by arrows, which can be subdivided into further arrows.

When adding additional tags to the quantity flow, you must consider at which position the tag is inserted. Before dropping, a circle appears at the arrowhead to be inserted. Drag the tag to be added to the top of the source arrow.
Historical analysis
By default, live values are displayed. The Preselected time configuration can be used to switch the vizual to evaluate the historical data.